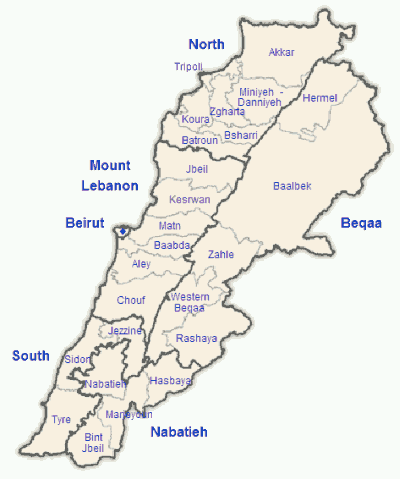
- Full name: The Lebanese Republic
- Population: 4.1 million (UN, 2008)
- Capital: Beirut
- Area: 10,452 sq km (4,036 sq miles)
- Major language: Arabic
- Major religions: Islam, Christianity
- Life expectancy: 70 years (men), 74 years (women) (UN)
- Monetary unit: 1 Lebanese pound (or lira) = 100 piastres
- Main exports: Foodstuffs and tobacco
- GNI per capita: US $5,770 (World Bank, 2007)
- Internet domain: .lb
- International dialling code: +961
- Education Budget:
- Healthcare Budget:
- Hospitals:
- Beds:
- Medical Devices/furniture imports:
Lebanon has a free-market economy and a strong laissez-faire commercial tradition. The government does not restrict foreign investment; however, the investment climate suffers from red tape, corruption, arbitrary licensing decisions, high taxes, tariffs, and fees, archaic legislation, and weak intellectual property rights. The Lebanese economy is service-oriented.
Main growth sectors of Lebanon include banking and tourism. The 1975-90 civil war seriously damaged Lebanon’s economic infrastructure, cut national output by half, and all but ended Lebanon’s position as a Middle Eastern entrepot and banking hub. In the years since, Lebanon has rebuilt much of its war-torn physical and financial infrastructure by borrowing heavily – mostly from domestic banks.

In an attempt to reduce the ballooning national debt, the Rafiq HARIRI government in 2000 began an austerity program, reining in government expenditures, increasing revenue collection, and passing legislation to privatize state enterprises, but economic and financial reform initiatives stalled and public debt continued to grow despite receipt of more than $2 billion in bilateral assistance at the 2002 Paris II Donors Conference.
The Israeli-Hizballah conflict in July-August 2006 caused an estimated $3.6 billion in infrastructure damage, and prompted international donors to pledge nearly $1 billion in recovery and reconstruction assistance. Donors met again in January 2007 at the Paris III Donor Conference and pledged more than $7.5 billion to Lebanon for development projects and budget support, conditioned on progress on Beirut’s fiscal reform and privatization program. An 18-month political stalemate and sporadic sectarian and political violence hampered economic activity, particularly tourism, retail sales, and investment, until the new government was formed in July 2008.
Political stability since the Doha Accord of May 2008 has helped to boost investment and tourism, but economic growth is likely to slow in 2009 as a result of the global economic recession.
GDP (purchasing power parity):
$44.06 billion (2008 est.)
country comparison to the world: 90
GDP (official exchange rate):
$28.94 billion (2008 est.)
GDP – real growth rate:
6.3% (2008 est.)
country comparison to the world: 53
GDP – per capita (PPP):
$11,100 (2008 est.)
country comparison to the world: 98
$10,600 (2007 est.)
GDP – composition by sector:
agriculture: 5.1%
industry: 18.8%
services: 76.1% (2008 est.)
Labor force:
1.481 million
country comparison to the world: 129
note: in addition, there are as many as 1 million foreign workers (2007 est.)
Labor force – by occupation:
agriculture: NA%
industry: NA%
services: NA%
Unemployment rate:
9.2% (2007 est.)
country comparison to the world: 119
Population below poverty line:
28% (1999 est.)
Household income or consumption by percentage share:
lowest 10%: NA%
highest 10%: NA%
Investment (gross fixed):
22.4% of GDP (2008 est.)
country comparison to the world: 77
Budget:
revenues: $6.998 billion
expenditures: $9.955 billion (2008 est.)
Public debt:
164.3% of GDP (2008 est.)
country comparison to the world: 3
Market value of publicly traded shares:
$9.641 billion (31 December 2008)
country comparison to the world: 73
$10.86 billion (31 December 2007)
$8.279 billion (31 December 2006)
Agriculture – products:
citrus, grapes, tomatoes, apples, vegetables, potatoes, olives, tobacco; sheep, goats
Industries:
banking, tourism, food processing, wine, jewelry, cement, textiles, mineral and chemical products, wood and furniture products, oil refining, metal fabricating
Electricity – production:
8.764 billion kWh (2006 est.)
country comparison to the world: 96
Electricity – consumption:
8.161 billion kWh (2006 est.)
country comparison to the world: 92
Electricity – imports:
929 million kWh (2006 est.)
Oil – consumption:
106,000 bbl/day (2006 est.)
country comparison to the world: 75
Oil – exports:
0 bbl/day (2005)
country comparison to the world: 176
Oil – imports:
97,590 bbl/day (2005)
country comparison to the world: 66
Current account balance:
-$3.023 billion (2008 est.)
country comparison to the world: 151
-$1.395 billion (2007 est.)
Exports:
$5.035 billion (2008 est.)
country comparison to the world: 108
$4.077 billion (2007 est.)
Exports – commodities:
jewellery, base metals, chemicals, miscellaneous consumer goods, fruit and vegetables, tobacco, construction minerals, electric power machinery and switchgear, textile fibres, paper
Exports – partners:
Syria 23.9%, UAE 12.4%, Switzerland 7.2%, Saudi Arabia 5.9%, Turkey 4% (2008)
Imports:
$16.25 billion (2008 est.)
country comparison to the world: 76
Imports – commodities:
petroleum products, cars, medicinal products, clothing, meat and live animals, consumer goods, paper, textile fabrics, tobacco, electrical machinery and equipment, chemicals
Imports – partners:
Syria 10.7%, France 9.7%, US 9.5%, Italy 7.4%, China 6.7%, Germany 5%, Saudi Arabia 4.9%, Turkey 4.3% (2008)
Reserves of foreign exchange and gold:
$28.28 billion (31 December 2008 est.)
country comparison to the world: 46
$20.55 billion (31 December 2007 est.)
Debt – external:
$34.03 billion (31 December 2008 est.)
country comparison to the world: 60
Exchange rates:
Lebanese pounds (LBP) per US dollar – 1,507.5 (2008 est.),