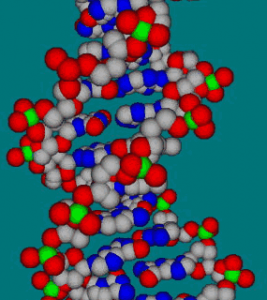
 Digital 3D models of the workings of genes are helping unpick the process of aging and how toxins poison the body.
Scientists are using the technique to give a fuller picture of which genes respond to toxins and how poisons corrupt the biochemistry of worms.
The software speeds up a process which used to involve sorting through thousands of entries in a spreadsheet.
The gene modelling system gives results in hours rather than the days or weeks typical with earlier techniques.
Gene chips
The modelling technique pairs data visualisation tools with results from micro-arrays, glass slides studded with samples of all the genes in an organism.
Dr Stephen Sturzenbaum, a researcher in school of biomedical & health sciences at King’s College, is using the technique to map the biochemical pathways inside earthworms and nematodes, specifically caenorhabditis elegans.
The earthworms and nematodes are being exposed to a variety of toxins and chemicals including cadmium, copper, atrazine, fluoranthene and the insecticide aldicarb.
“We want to see what happens if we expose worms to this stuff,” he said.
“We knock out the gene that’s produced a protein and compare one type to another,” said Dr Sturzenbaum.
The samples are washed over gene chips to find active genes
The idea, he said, was to reveal how the normal workings of genes changed under the influence of various toxins.
These genetic effects are revealed by washing samples across a chip covered with genes. In the case of the nematodes this is every gene they possess but far fewer for the earthworms.
Before now, said Dr Sturzenbaum, such a technique generated a huge amount of data that was hard to pick through and spot trends.
“It can generate 100,000 or more data points,” said Dr Sturzenbaum. “You can spend weeks on a data set.”
The time to analyse the data has been significantly shrunk thanks to modelling software that swiftly maps active genes in three-dimensions.
Data overload
Dr Matthew Arno, manager at the Genomics Centre at King’s College, said the novel modelling technique helped gene researchers home in on trends much more quickly.
“We measure everything and look for the best and biggest that are significant and interesting,” he said. “A time ago you just were presented with a table in Excel and you had to get something out of it.”
“You had to be a mathematician, a statistician and computer expert,” he said.
It could take days or weeks to comb through the gigabytes of data and work out which genes were turning on and off together, he said.
“You see in real time what is happening to your data,” said Dr Arno, “even though it is fairly expensive it saves time, which is money.”
The modelling software, called Qlucore, being used at King’s was developed by Dr Thoas Fioretos who saw a need for it while studying the genetics of cancer expression.
A better way of modelling and mapping genetic information was needed in the wake of the projects that identified all the genes in different genomes.
“We moved within one year from getting one gene a week to getting information on thousands of genes in a matter of hours,” he said. “That put a lot of challenges to us.
“I felt that the data was so difficult to analyse it got out of our hands.”
“The visualisation software allows us to do more much more than just ask a mathematician or biomathematician to do the analysis for us,” said Dr Fioretos.
“If you do not have this type of software, it’s like sitting in front of an Excel spreadsheet with 6,000 pages. You cannot find patterns in that, you cannot ask if this gene is expressed with another.”
But despite the successes of the modelling technique, researchers say their understanding is not yet complete.
“Even though elegans is fully sequenced we do not know what every gene does,” said Dr Sturzenbaum. “In some cases you can be 100% sure, in some you can only guess and in some its unknown as only about one-third of the genes that are annotated.
“There’s still a long way to go,” he said.
